HAMi AI Platform Edition Online Deployment Guide
This document is intended for SRE / platform engineers. It describes how to deploy HAMi AI Platform on a Kubernetes cluster and complete integration and functional verification with foundational components such as HAMi, Prometheus, NVIDIA GPU Operator, and Gateway.
⚠️ Installation ≠ Activation
After completing the Helm Charts installation in this section, the HAMi AI Platform components will run, but the underlying GPU virtualization and scheduling features of HAMi AI Platform require an activated license to function normally.
The installation itself does not depend on a licence; you can complete the deployment first, then apply for and import the licence in subsequent steps.
In short: install the software first, then obtain the licence; if not activated, vGPU partitioning and scheduling functionality will be unavailable, and function verification will also fail.
Prerequisites Checklist
| Type | Requirement | Verification Command |
|---|---|---|
| Kubernetes | ≥ 1.24 | kubectl version --short |
| Container Runtime | containerd or Docker | kubectl get nodes -o wide |
| Helm | ≥ 3.14 | helm version --short |
| GPU Driver | NVIDIA driver ≥ 470 (recommended ≥ 550) | nvidia-smi |
| Prometheus CRD | Prometheus monitoring CRD must be installed to be compatible with different monitoring metric collection systems: Prometheus, VictoriaMetrics, etc. | kubectl api-resources | grep monitoring.coreos.com/v1 |
| GPU Operator | Installed and devicePlugin.enabled = false, recommended version: v25.3.2) | helm list -A | grep gpu-operator |
| Storage Space | Recommended greater than 30 GB | df -h |
Key Constraint: HAMi includes its own device-plugin, which conflicts with the built-in device-plugin of the NVIDIA GPU Operator. If GPU Operator is already installed, be sure to disable its built-in plugin with --set devicePlugin.enabled=false.
Installation
Two installation paths; choose according to your scenario:
- Online OCI installation (evaluation, PoC, clusters with external network access)
- All-in-One offline package (finance / government / telecom isolated network scenarios)
Regardless of the installation method, you will eventually need to apply for a licence and activate.
Path A: Online Helm Charts Installation
If you want to use a Chinese mainland mirror registry, please contact Dynamia.ai's pre-sales / technical support for relevant information.
It is recommended to use a version control system to maintain the values files for all Helm Chart releases in the cluster. Use -f example-values.yaml to override the corresponding keys in the default values of the Charts.
After selecting the appropriate kubeconfig context, proceed with the following steps:
If nvidia/gpu-operator is not installed, install it first.
helm repo add nvidia https://helm.ngc.nvidia.com/nvidia && helm repo update

helm install --wait --generate-name \
  -n gpu-operator --create-namespace \
  nvidia/gpu-operator \
  --set devicePlugin.enabled=false \
  --set dcgmExporter.serviceMonitor.enabled=true \
  --version=v25.3.2
If the cluster does not have a Prometheus monitoring stack, it also needs to be installed. Here we show how to install prometheus-community/kube-prometheus-stack.
helm install prometheus \
  oci://ghcr.io/prometheus-community/charts/kube-prometheus-stack \
  --version 72.3.0 \
  --namespace monitoring \
  --create-namespace \
  --set alertmanager.enabled=false \
  --set grafana.enabled=false
Install dynamia-ai/hami-enterprise:
helm install hami \
  oci://ghcr.io/dynamia-ai/charts/hami-enterprise \
  --version 2.9.0-rc2 \
  --namespace hami-system \
  --create-namespace
Common Chart customization options for hami-enterprise are shown in the table below. For the complete values configuration, see: HAMi Helm Chart Values Reference.
| Parameter | Description | Default Value |
|---|---|---|
dra.enabled | Whether to deploy and enable DRA | false |
scheduler.leaderElect | Whether to enable multi-node leader election for hami-scheduler | true |
scheduler.replicas | Adjust the number of hami-scheduler instances | 1 |
scheduler.kubeScheduler.image.registry | Image registry for the kube-scheduler used by hami-scheduler. | "registry.cn-hangzhou.aliyuncs.com" |
scheduler.kubeScheduler.image.repository | Image repository for the kube-scheduler used by hami-scheduler. | "google_containers/kube-scheduler" |
scheduler.kubeScheduler.image.tag | Image tag for the kube-scheduler used by hami-scheduler. If left blank, the chart will infer a suitable version. | "" |
Compared with HAMi, the AI Platform platform service additionally relies on the Kubernetes Gateway API as the default service exposure method (with envoy-gateway). If you require it and your cluster does not have Gateway API (check with kubectl api-resources | grep gateway.networking.k8s.io/v1), please install it first.
If there is no Gateway API implementation in the cluster, install envoyproxy/envoy-gateway to expose services:
helm install eg \
  oci://docker.io/envoyproxy/gateway-helm \
  --version v1.6.2 \
  --namespace envoy-gateway-system \
  --create-namespace \
  --set global.images.envoyGateway.image=docker.io/envoyproxy/gateway:v1.6.2 \
  --set global.image.ratelimit.image=docker.io/envoyproxy/ratelimit:99d85510 \
  --set config.envoyGateway.gateway.controllerName=gateway.envoyproxy.io/gatewayclass-controller \
  --set config.envoyGateway.provider.type=Kubernetes
Install dynamia-ai/kantaloupe (AI Platform platform service, hereinafter referred to as kantaloupe):
helm install kantaloupe \
  oci://ghcr.io/dynamia-ai/kantaloupe/kantaloupe-chart \
  --version 0.17.6 \
  --namespace kantaloupe-system \
  --create-namespace \
  --set fullnameOverride=kantaloupe
kantaloupe requires configuration for feature toggles, service exposure, monitoring metrics collection, and more, so there are many configuration options. Configure as needed. For the complete values reference, see kantaloupe Helm Chart Value Reference.
Common configuration values examples are below. You can combine multiple snippets to form a complete values file:
- Configure default platform administrator credentials
auth:
  jwtSecret: "your-own-jwt-secret"
  bootstrapAdminUsername: "bootstrap-platform-admin"
  bootstrapAdminPassword: "admin12345"
  bootstrapAdminFullName: "Platform Administrator"
  bootstrapAdminEmail: "admin@email.com"
- Expose services using envoy-gateway NodePort, and use an external LoadBalancer (cloud provider load balancer, self-built load balancer, etc.) to forward L4 traffic.
gateway:
  enabled: true
  hostnames:
    - your-domain.example.com
  apiserverCors:
    enabled: true
    allowCredentials: true
    allowOrigins:
      - https://your-domain.example.com
  envoy:
    service:
      ports:
        http:
          nodePort: 30080
        https:
          nodePort: 30443
      type: NodePort
  listeners:
    - name: http
      port: 80
      protocol: HTTP
    - name: https
      port: 443
      protocol: HTTPS
      tls:
        certificateRef:
          name: your-domain-tls-secret
        redirectFromHttp: true
- Expose services using envoy-gateway NodePort, simple PoC
gateway:
  enabled: true
  listeners:
    - name: http
      port: 80
      protocol: HTTP
  envoy:
    service:
      type: NodePort
      ports:
        http:
          nodePort: 30080
- Use a LoadBalancer service managed by a cloud provider or bare-metal load balancer controller
gateway:
  enabled: true
  hostnames:
    - your.domain
  listeners:
    - name: http
      port: 80
      protocol: HTTP
    - name: https
      port: 443
      protocol: HTTPS
      tls:
        certificateRef:
          name: your-tls-secret
        redirectFromHttp: true
  envoy:
    service:
      type: LoadBalancer
      ports:
        http: {}
        https: {}
- Do not use Gateway API; handle service exposure manually.
gateway:
  enabled: false
- Replace the Prometheus Query API address (default is
http://prometheus-kube-prometheus-prometheus.monitoring.svc.cluster.local:9090)
apiserver:
  prometheusAddr: http://your-prometheus-query-api.com:9090

controllerManager:
  prometheusAddr: http://your-prometheus-query-api.com:9090
Path B: All-in-One Offline Package
Please contact Dynamia.ai's pre-sales / technical support partners for the download address and operation manual.
Enable GPU Nodes
HAMi device-plugin only starts on nodes with the gpu=on label (can be applied manually):
kubectl label nodes <node-name> gpu=on
Verify: kubectl -n hami-system get pods should show hami-device-plugin-* and hami-scheduler-* in Running state.
Monitoring Integration
Ensure the monitoring metric system in the cluster (kube-prometheus-stack Prometheus, VictoriaMetrics vmagent, etc.) can collect HAMi and DCGM-Exporter metrics.
If using Prometheus, the metadata.labels of the ServiceMonitor resource must match the spec.serviceMonitorSelector field of the Prometheus resource; otherwise Prometheus will not collect these metrics.
If using VictoriaMetrics, the metadata.labels of the ServiceMonitor resource must match the spec.serviceScrapeSelector field of the VMServiceScrape resource; otherwise vmagent will not collect these metrics.
Verify Metric Collection
| Exporter | Query Metric | Expected |
|---|---|---|
dcgm-exporter | DCGM_FI_DEV_GPU_UTIL | Returns a non-empty value |
hami-exporter | HostCoreUtilization | Returns a non-empty value |
hami-device-plugin-exporter | GPUDeviceCoreAllocated | Returns a non-empty value |
In addition to exporter metrics, you also need to query kantaloupe_gpu_temp to verify that kantaloupe service metrics are being collected correctly.
Licence Acquisition
Please complete the installation tasks above and ensure that all component Pods are running normally before starting the activation process.
Execute the following script to collect licence information (requires kubectl, jq):
# Online script acquisition
curl -fsSL https://public.hami.run/collect-hami-license-info.sh | bash

# Offline installation (included in the package)
bash collect-hami-license-info.sh
After execution, you will see the following JSON content:
{
  "esn": "96565d61-986a-4918-aafb-448ff6e3746b",
  "deviceInstances": [
    {
      "uuid": "GPU-ceee905d-48ac-93de-a81b-17c00e1e5e02",
      "deviceType": "NVIDIA A10"
    }
  ]
}
Send the above JSON to Dynamia.ai's pre-sales / technical support to obtain the licence.
Post-Activation Verification
# 1. Pod status
kubectl -n hami-system get pods

# 2. GPU resources registered by the Device Plugin
kubectl describe node <gpu-node> | grep -A 5 'Capacity:'
# Expected to see: nvidia.com/gpu: <N> and nvidia.com/gpumem: <MB>

# 3. Submit a test Pod to verify scheduling
cat <<EOF | kubectl apply -f -
apiVersion: v1
kind: Pod
metadata:
  name: hami-smoke
spec:
  restartPolicy: Never
  containers:
  - name: cuda
    image: nvidia/cuda:12.4.0-base-ubuntu22.04
    command: ["nvidia-smi"]
    resources:
      limits:
        nvidia.com/gpu: 1
        nvidia.com/gpumem: 2000
EOF

kubectl logs hami-smoke
Expected: the nvidia-smi output should show GPU information, and the video memory should be limited to 2000 MiB.
HAMi AI Platform Verification
# 1. Pod Status
kubectl -n kantaloupe-system get pods

# 2. Service Accessibility
kubectl -n kantaloupe-system get svc
After the HAMi AI Platform service is exposed, open the site and confirm that the frontend and backend are working normally.
Create Workload
On the console Workload page, create an application (e.g., gpu-burn):
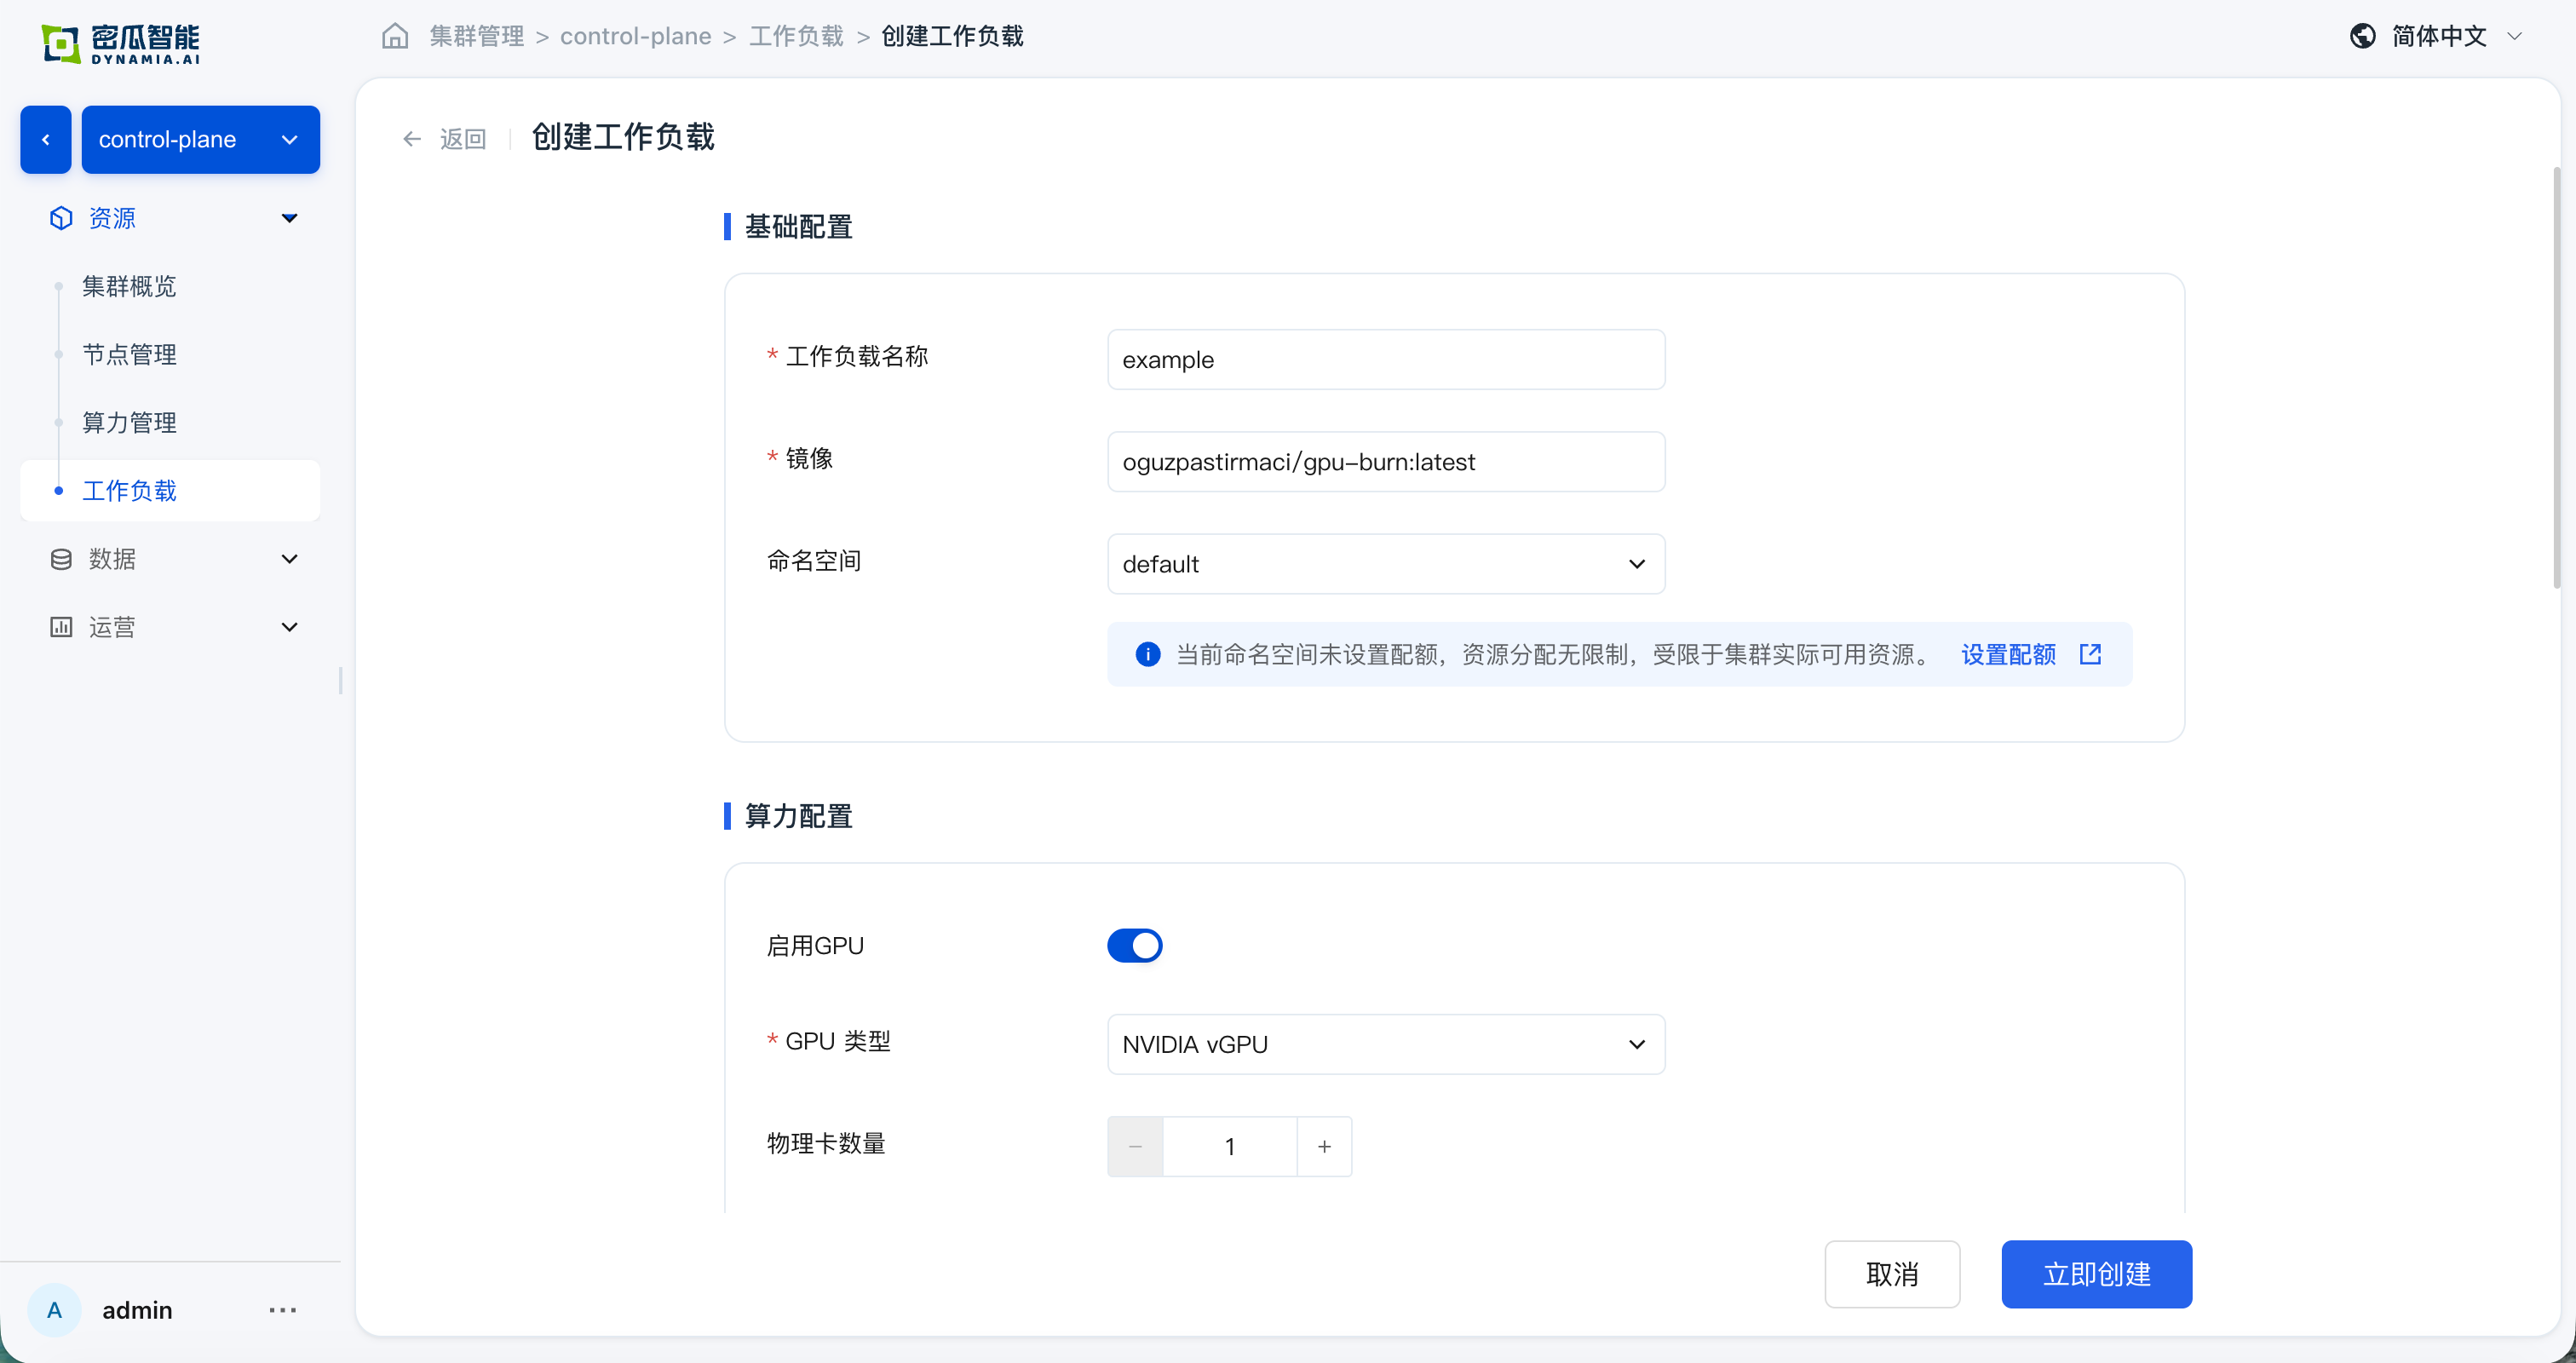
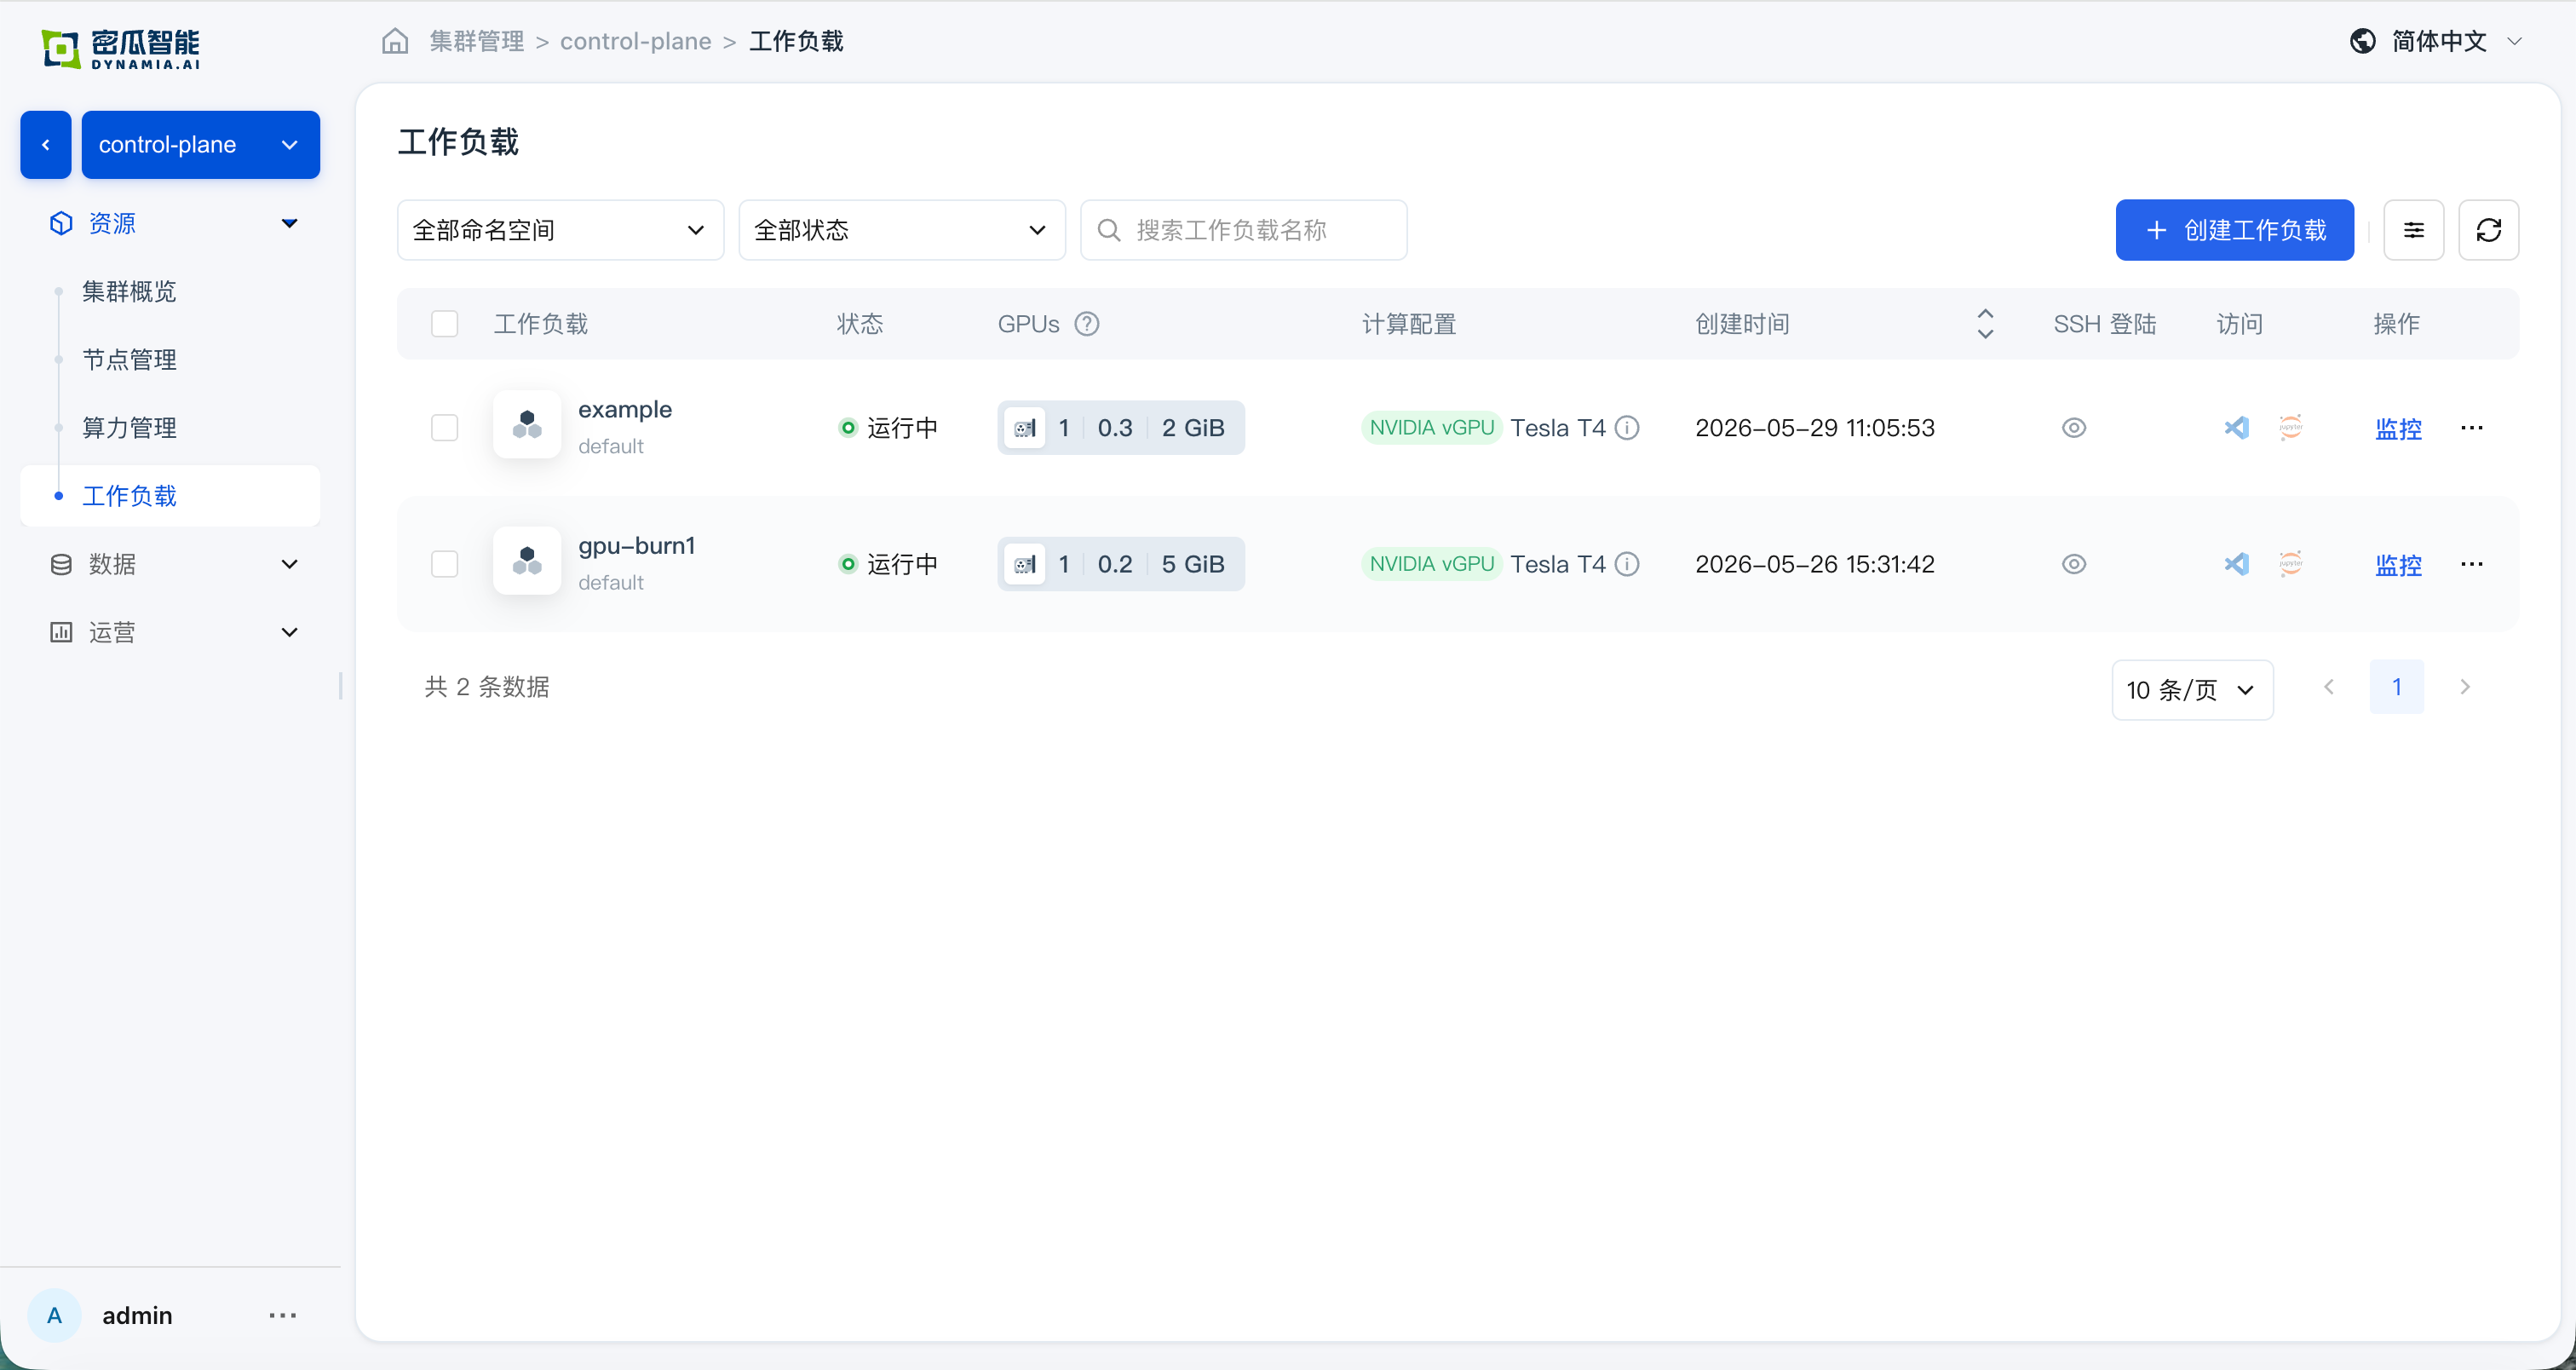
After creation, confirm that the following verification items all pass:
- Creation successful, no errors in the console
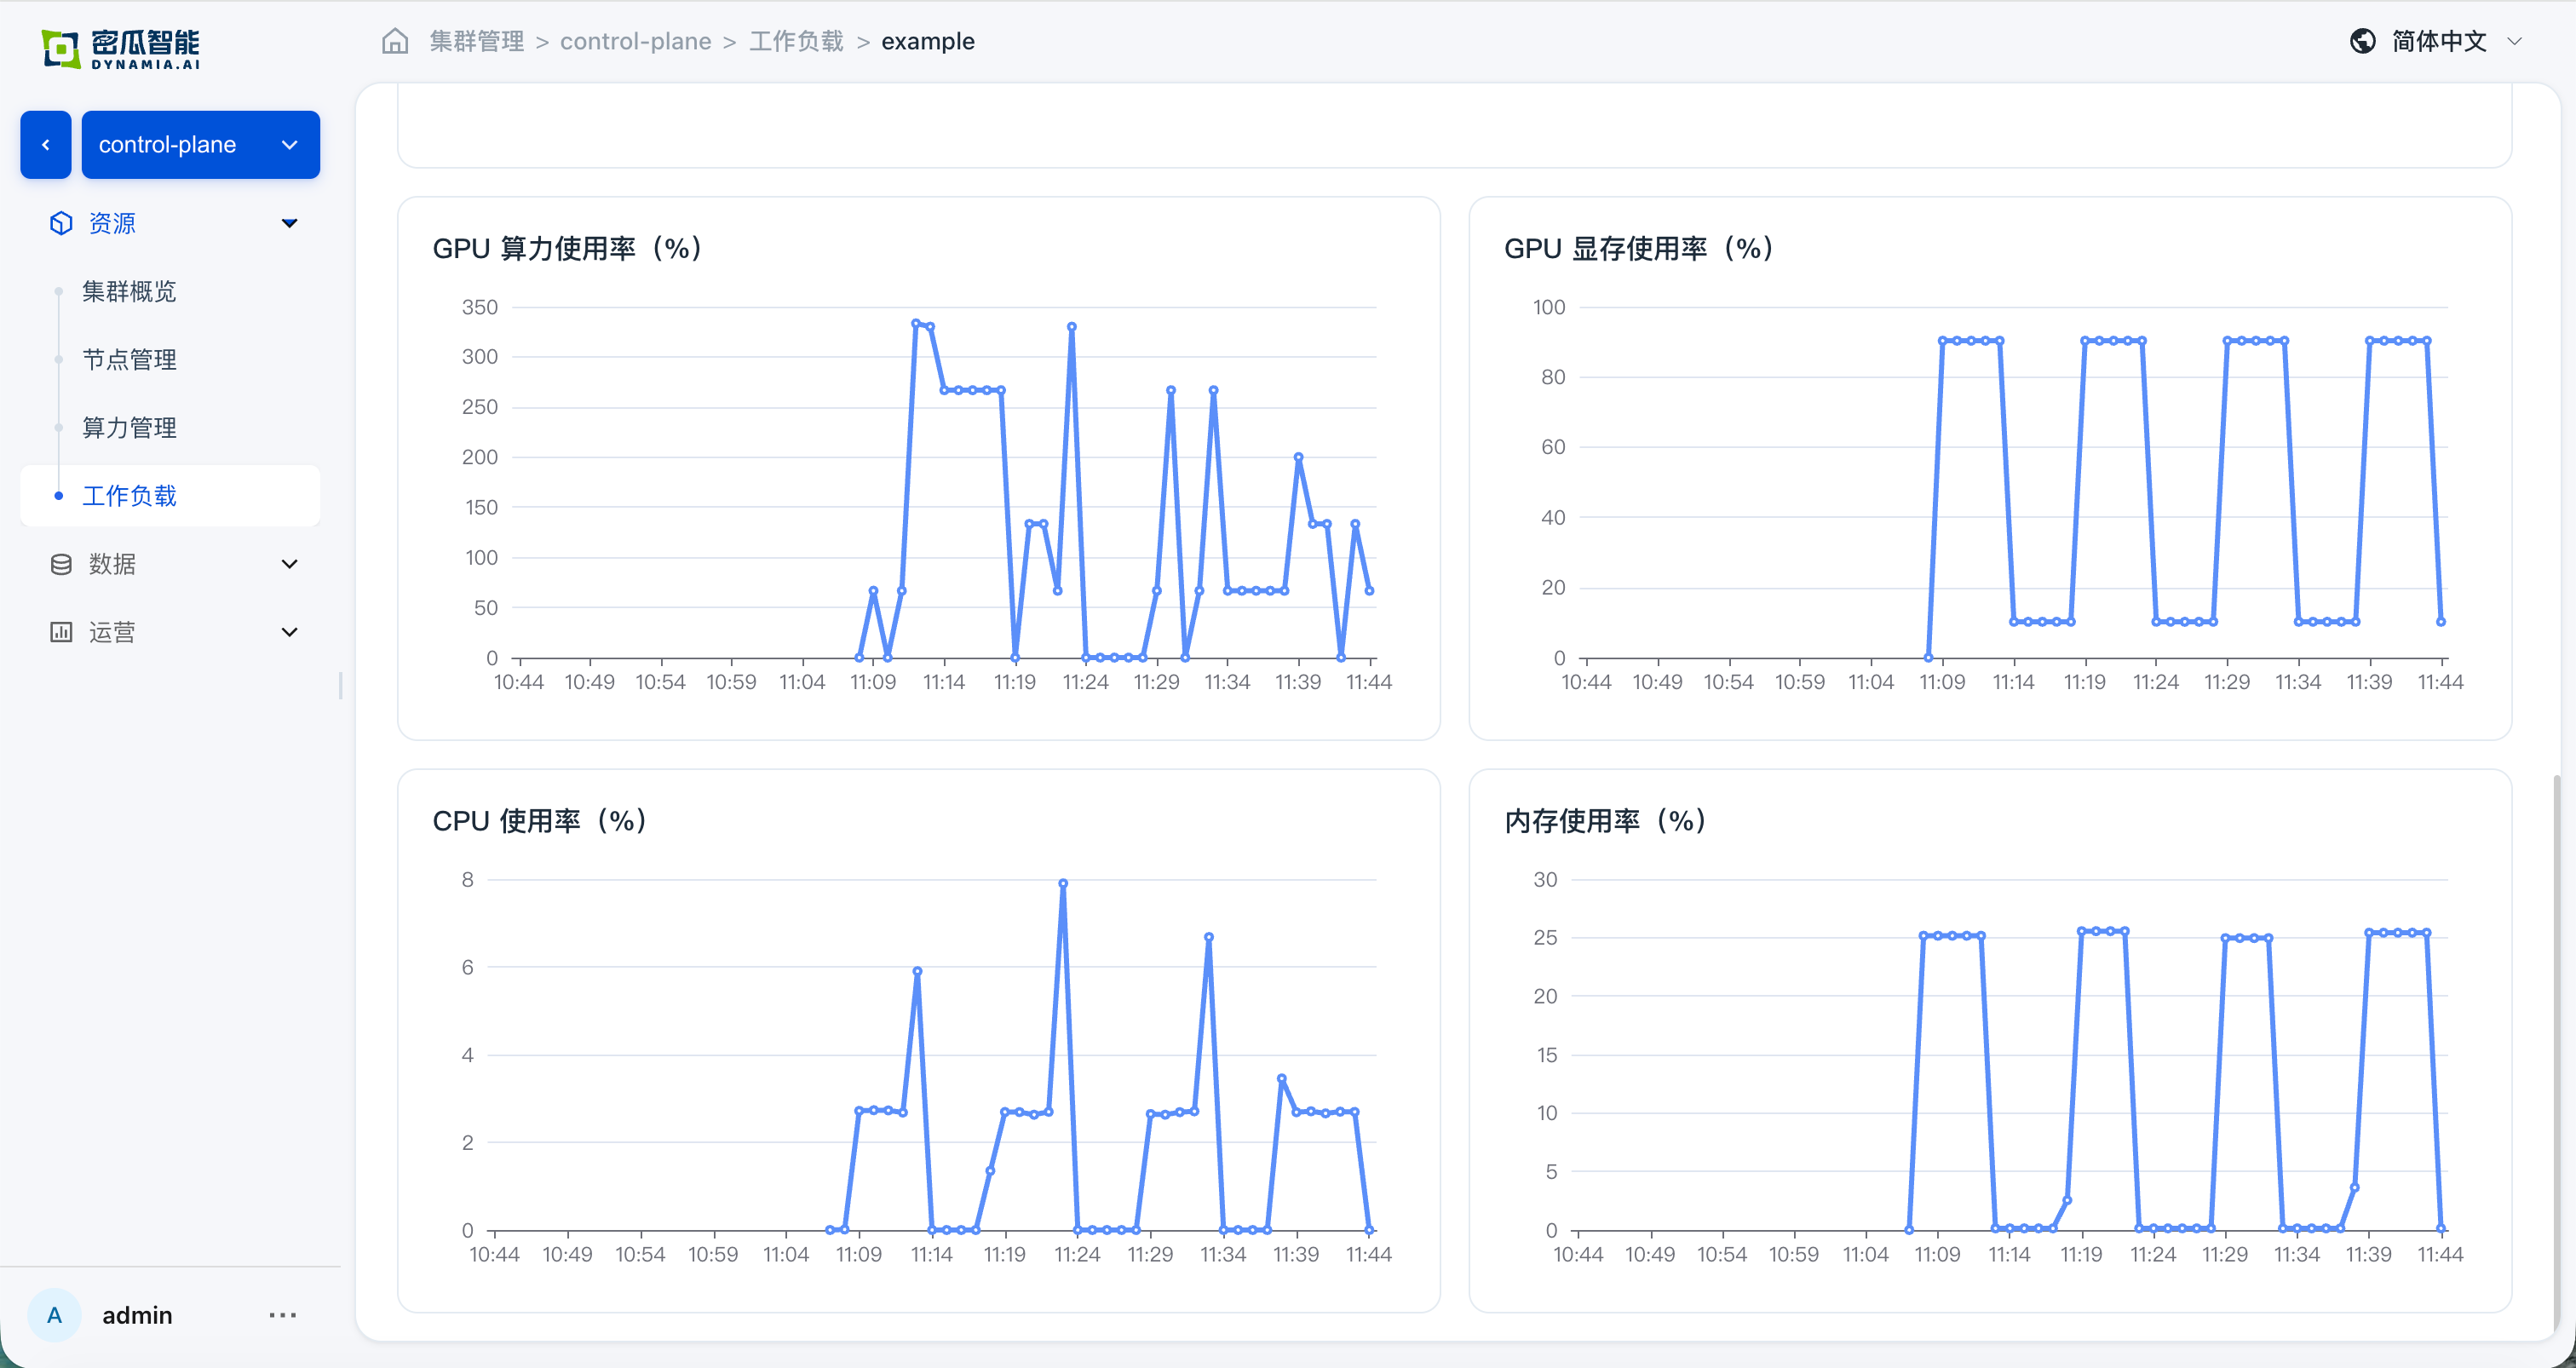
- Workload list: application status, search, list metrics, and monitoring panels (GPU SM / GPU MEM / CPU / Memory) are normal; time switching and charts meet expectations
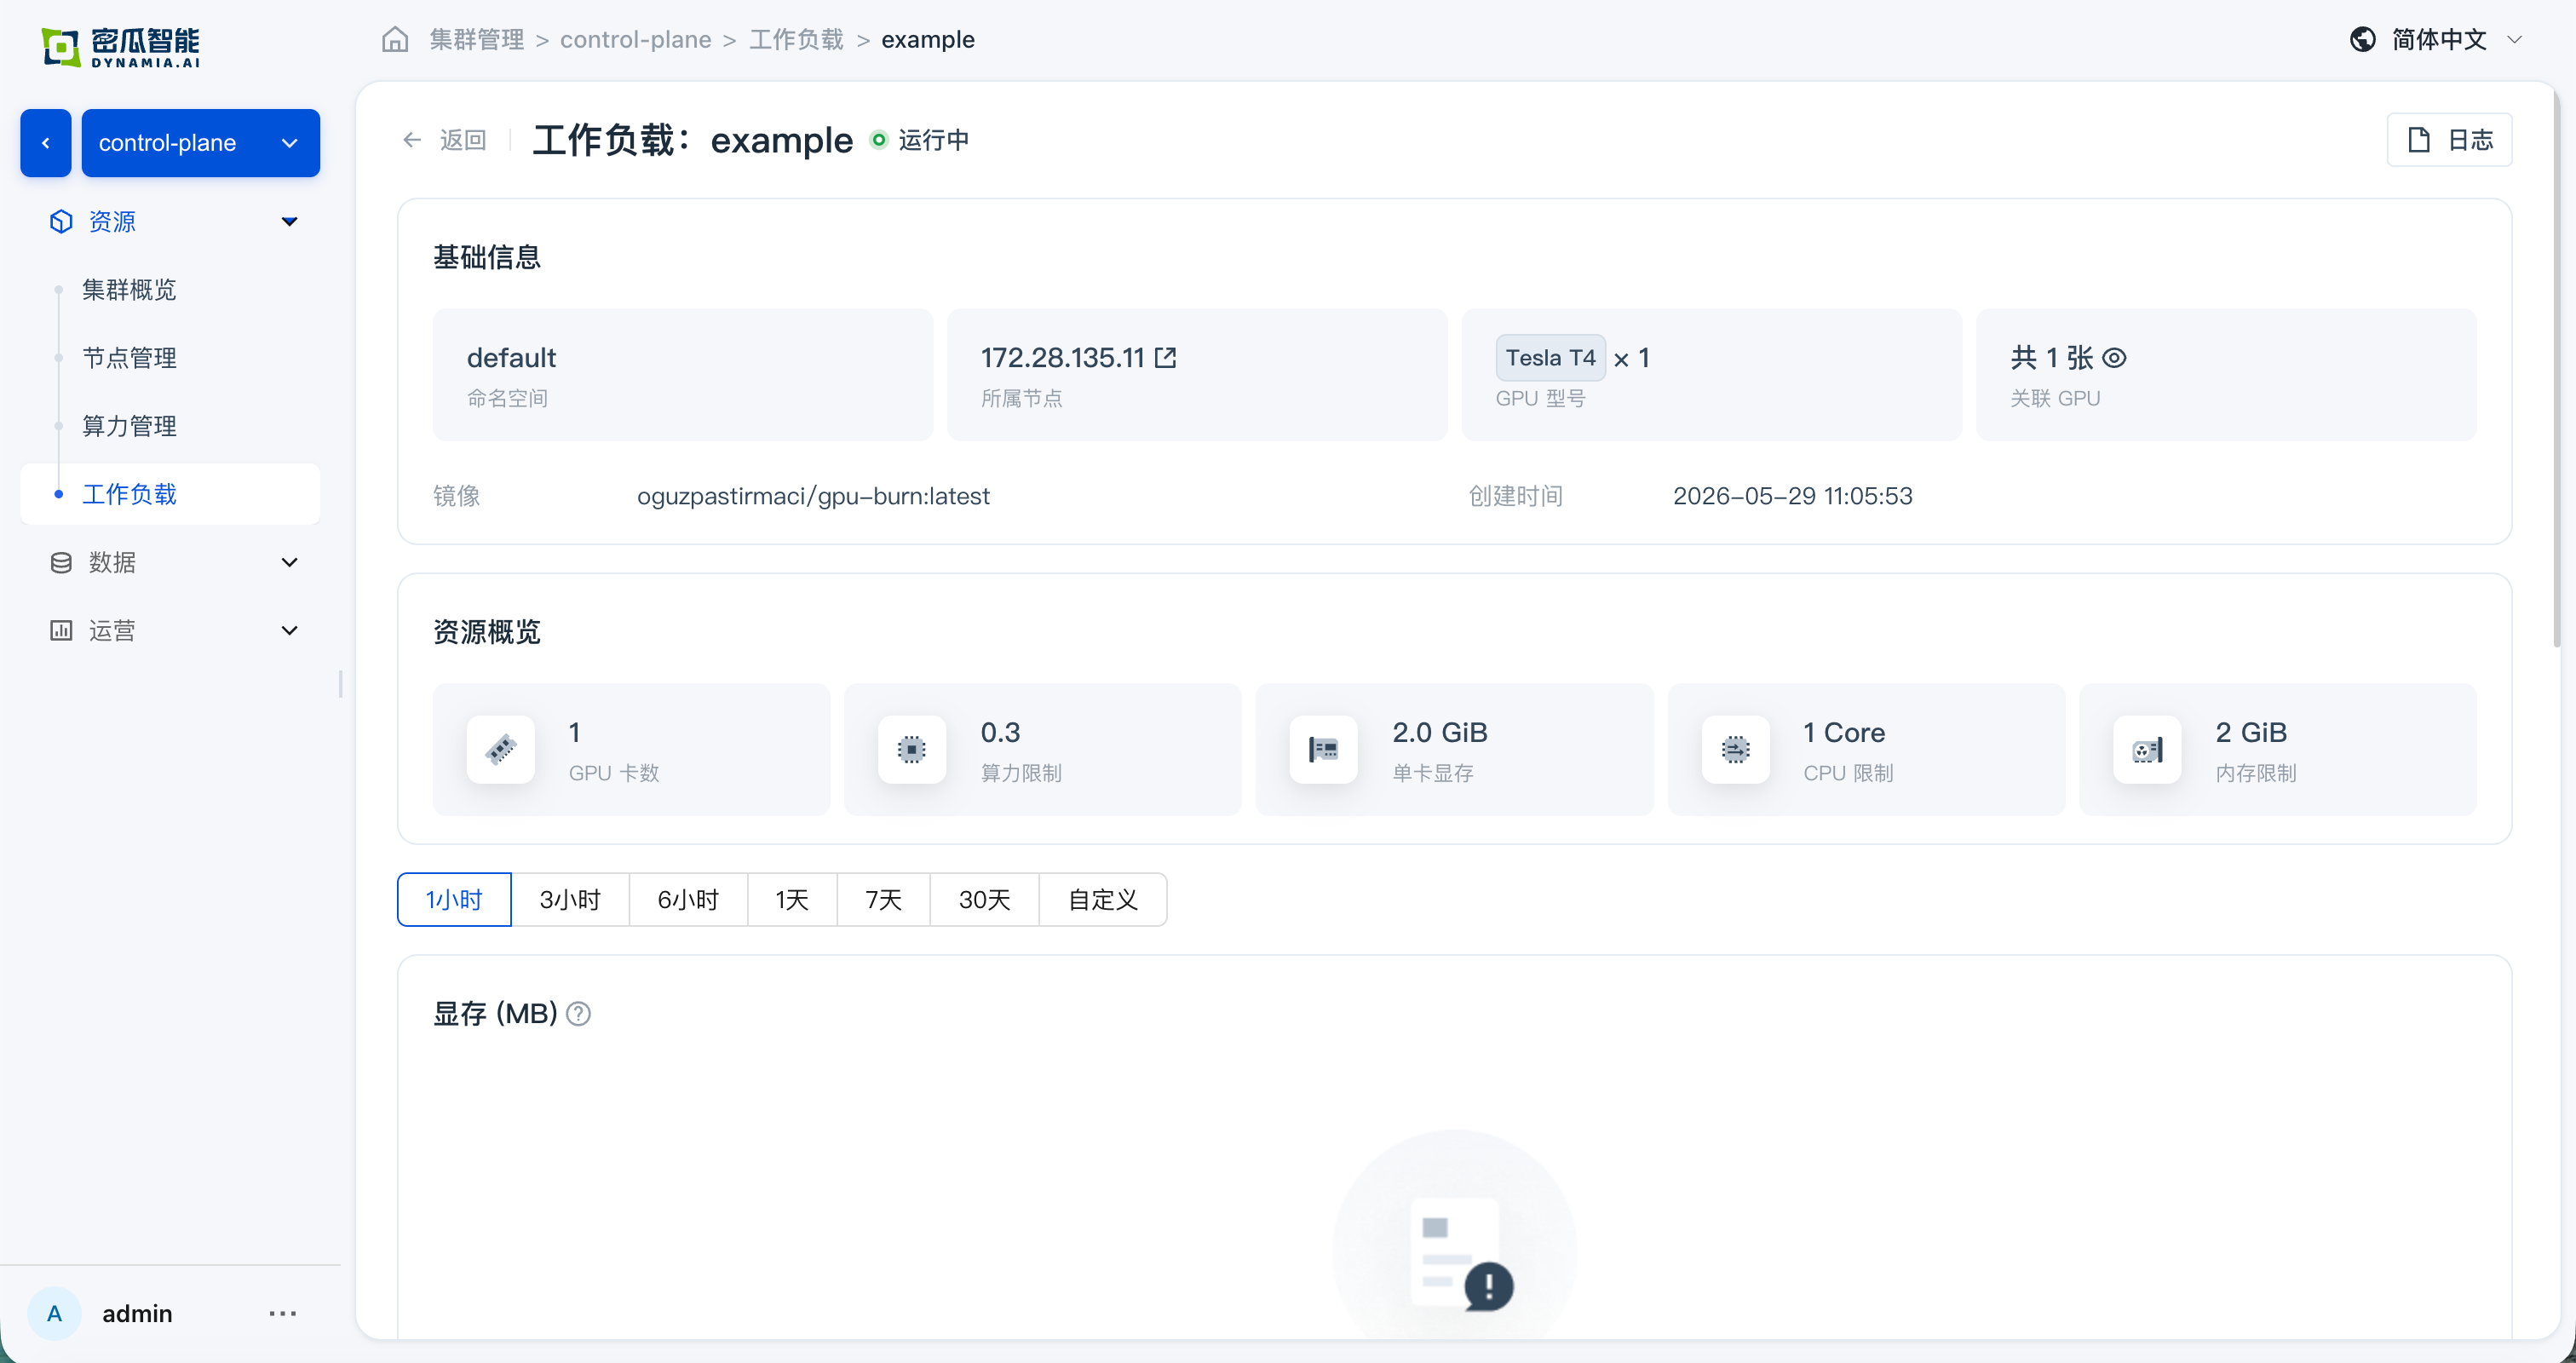
- Application details: basic information, resource overview, and monitoring data are normal; navigating from the detail page to the GPU / Node page, resource overview and monitoring data are normal
FAQ
| Symptom | Possible Cause | Resolution |
|---|---|---|
| Image pull fails | The node has no external network or poor connectivity to ghcr.io. | Contact Dynamia.ai pre-sales/technical support to obtain a domestic mirror registry address or an All-in-One offline bundle. |
hami-device-plugin Pod Pending or missing | The node is not labeled with gpu=on. | kubectl label nodes <node> gpu=on |
hami-device-plugin Pod CrashLoopBackOff | Conflicts with the NVIDIA default device-plugin. | Disable the GPU Operator devicePlugin (--set devicePlugin.enabled=false). |
| HAMi metrics not found | The Prometheus resource's serviceMonitorSelector does not match the labels in the ServiceMonitor resource. | Align prometheus/prometheus-kube-prometheus-prometheus's spec.serviceMonitorSelector and hami-enterprise's serviceMonitor labels. |
nvidia-smi error | GPU driver not ready. | Check the driver Pod status in the gpu-operator namespace. |
Sample workload Pending | License not activated, insufficient GPU, or missing node labels. | Check the license, GPU node labels, and kubectl describe pod events. |
Gateway has no ingress address | Envoy Gateway not ready or Service type not suitable for the cluster. | Check the envoy-gateway-systemService and Gateway status. |
Get Support
- Email: info@dynamia.ai
- Pre-sales / Technical Support: 400-026-7800
- Customers with signed commercial contracts please submit issues through the dedicated support channel